|

|
|
|||
|
Illustrations
of how water clarity can be improved by a slow sand
filter
What are these pictures?
In pictures A and B We are looking to see if the slow sand filters being tested become more efficent over extended periods of time, and if there is any improvement between filtered and unfiltered water. Pictures 1a and 1b are visual evidence that this slow sand filter is still operating after 30 months without being cleaned. Please note this is NOT a "biosand" filter, although it is very similar. This test does NOT mean that any other filter can go this long without being cleaned. This test DOES NOT show pathogens in the water. Water can be very clear and still contain harmful bacteria. Because the water being filtered here by the slow sand filter has a very low turbidity (but still contains pathogens before filtering) we are using a small low power red laser beam to check water clarity. The laser passes through the water and a photo is taken of the light reflecting from particles in the water, producing what looks like a red "line".
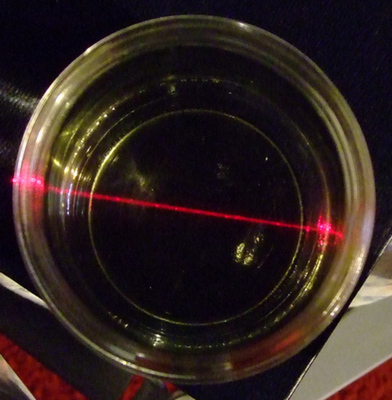
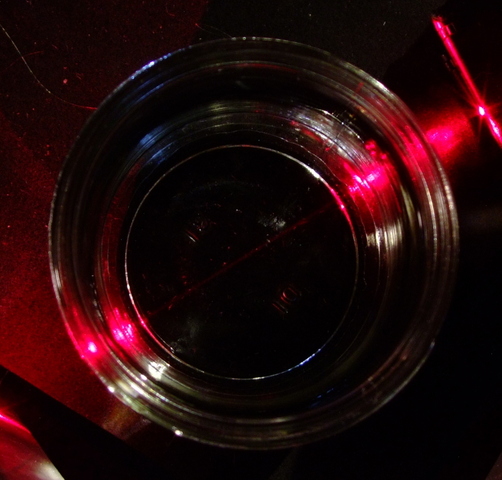
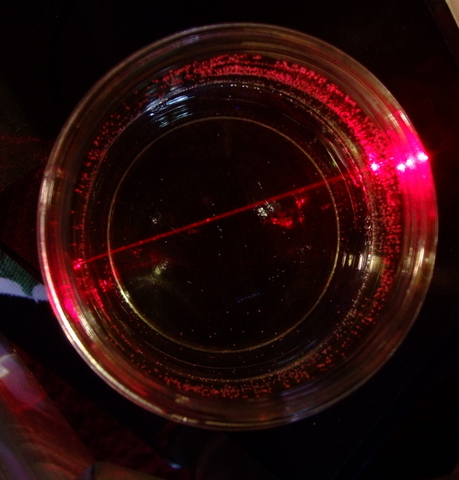
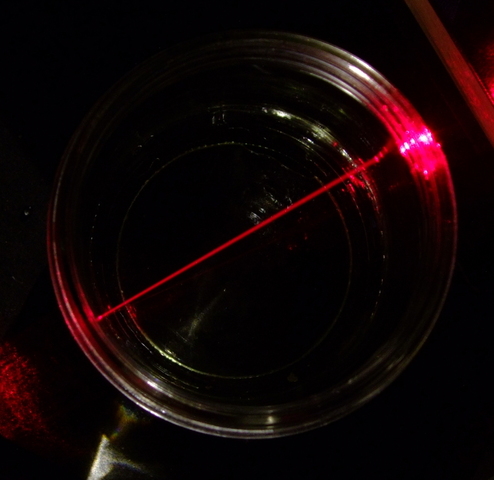
A reliable epa approved commercial 10 stage water filter is used as a basis for comparison as shown in pictures C and D. Water before it passes through this 10 stage filter is known to have more particles in it than it does after it has passed through the filter. The pictures show a difference; and thus we know this is a reliable method of checking the quality of water with respect to particulate matter content.
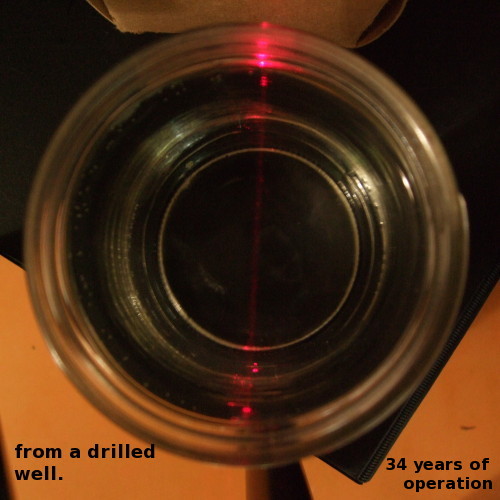
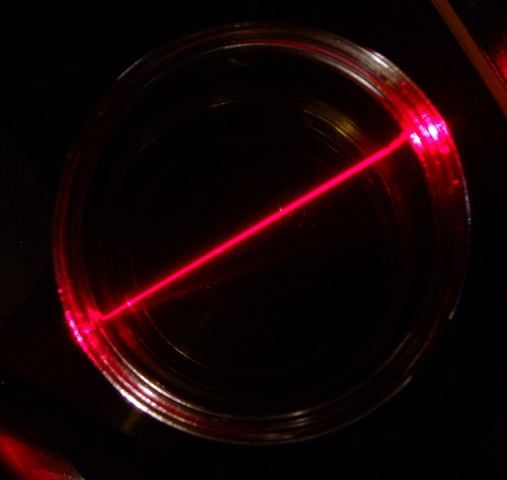
It is necessary to let the bubbles in the water disperse before checking, or the light will be reflected from bubbles and particulate matter. The intensity of the color of the line is directly proportional to the concentration of particles in the water - in other words more particulate matter in the water will produce a more intense colored line and will indicate poorer water quality. This is a qualitative test - not quantitative. This is NOT a scientific "turbidity test" and no "numbers" are produced. This test demonstrates improvements in clarity resulting from more efficient removal of particulate matter from water by the ( slow sand ) filters being tested.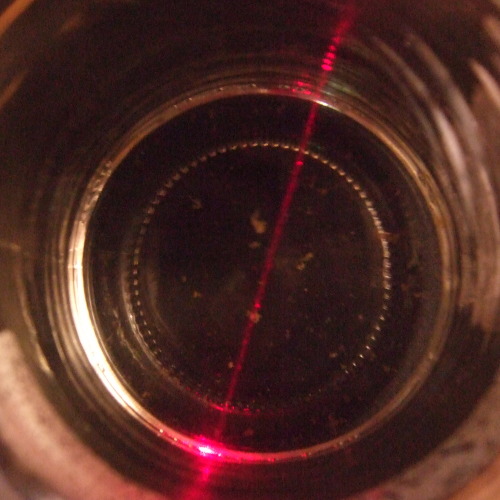 Picture A "Washed" roof water from storage tank before running through Filter 1. |
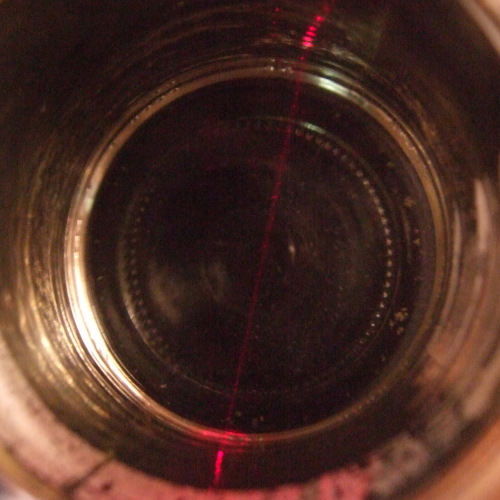 Picture B This is water filtered by a slow sand filter (Filter 1) after it has been in continuous operation for 12 months it has a low flow rate but cleans the water exceptionally well. |
 Picture 1 A "Washed" roof water from storage tank before running through Filter 1. 2010-11-13 |
 Picture 1 B This is water filtered by a slow sand filter (Filter 1) after it has been in continuous operation for 30 months (2010-11-13) |
 Picture C Well water before filtration. For the above images originals: All the pictures, including the ones taken 2010:11:13, were taken with the same settings, the same containers, the same laser, and the same camera. Image Type: jpeg (The JPEG image format) Width: 2848 pixels Height: 2136 pixels Camera Brand: FUJIFILM Camera Model: FinePix F60fd Date Taken: 2009:04:12 14:11:41 picture 1a and 1b taken 2010:11:13 Exposure Time: 1/4 sec. Aperture Value: 3.00 EV (f/2.8) ISO Speed Rating: 800 Flash Fired: Flash did not fire, compulsory flash mode. Metering Mode: Pattern Exposure Program: Normal program Focal Length: 8.0 mm Software: Digital Camera FinePix F60fd Ver1.00 |
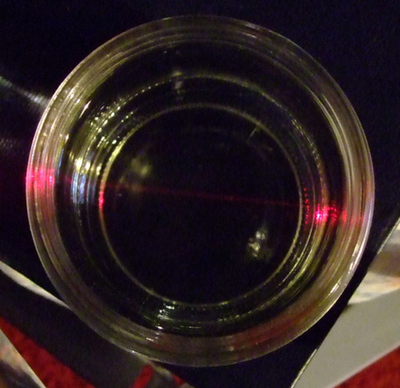
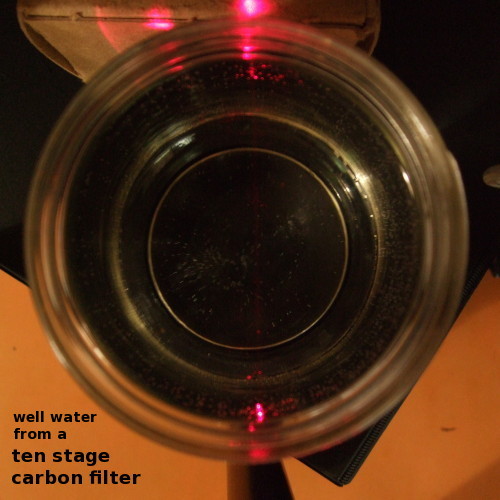 Picture D This is the water from the well that is referred to in the picture at the left after it has been filtered by a 10 stage carbon filter. |
 Bottled water This water has a turbidity of .35 NTU (the best of 4 samples was chosen for the website). |
 Unfiltered shallow well water This water has a turbidity of .22 NTU |
 Unfiltered pond water This water has an turbidity of 1.9 NTU. It is unfiltered water from a pond filled by rain water. |
 Filtered roof water This is the water from filter 1 that has been stored for a year in the storage tank. The turbidity is .32 NTU (better than bottled water). |
| Now, the question is why are the darker red lines testing with lower turbidity (better quality) in some cases? Most likely; air bubbles. And note that there is a significant difference between the 1.9 NTU and those that are less than .5 NTU. See the faq page for an explanation of NTU. | |
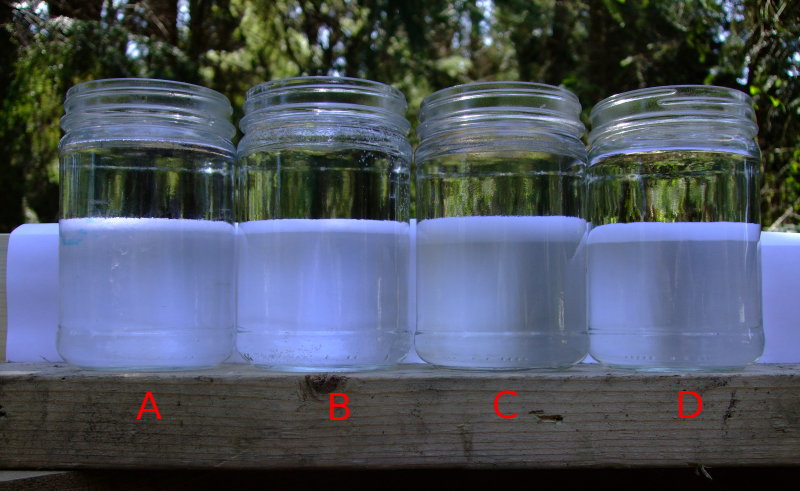 Picture E Can you tell by looking which of these samples is unfiltered well water, filtered well water, unfiltered roof water, or filtered roof water? The water is so clear that imperfections in the glass will influence your judgement. It is much easier using the red laser. It is important to note that even though water is clear, it still can contain bacteria that will make a person very sick. A (is 10 stage carbon) filtered well water (the clearest); B is unfiltered well water; C is unfiltered roof water; D is slow sand filtered roof water |
|
| back to introduction | |

This work is licensed under a Creative Commons Attribution-Noncommercial-Share Alike 3.0. terms of use